Introduction: Hello friends, in this article i
will explain that how we can bind dropdownlost dynamically in asp.net.This
article is very useful for the all the .net developer. In this article i’ll the
logic to bind the dropdownlist with the column of a table of the sql server in
asp.net.
Implementation: create a new website add a page bind_dropdownlist.aspxmpage. Drag and
drop a dropdownlist from the toolbox
inside the <body> body tag at the .aspx page. Below i
am giving the complete code for the html page and .cs page.
Code for bind_dropdownlist.aspx page
<head runat="server">
<title>Bind Dropdownlist</title>
</head>
<body>
<form id="form1" runat="server">
<div>
<asp:DropDownList ID="dd_name"
runat="server">
</asp:DropDownList>
</div>
</form>
</body>
</html>
Code for bind_dropdownlist.aspx.cs
page
using System;
using
System.Collections.Generic;
using
System.Linq;
using
System.Web;
using
System.Web.UI;
using
System.Web.UI.WebControls;
using
System.Data.SqlClient;
using
System.Configuration;
public partial class bind_dropdownlist : System.Web.UI.Page
{
SqlCommand cmd = new
SqlCommand();
SqlConnection con = new
SqlConnection();
protected void
Page_Load(object sender, EventArgs e)
{
// here i am declare connection
con.ConnectionString = ConfigurationManager.ConnectionStrings["cn"].ConnectionString;
con.Open();
if (Page.IsPostBack == false)
{
// here i am calling function chart_bind(); in the page load event of the
page
bind_dd();
}
}
private void
bind_dd()
{
cmd = new SqlCommand();
// here inside the cmd i am definning sql query to select
the name from the table
cmd.CommandText
= "select name from tb_student_detail group by name order by name";
cmd.Connection
= con;
// here i am declairing the SqlDataReader to catch the
values that will come from the sql query
SqlDataReader dd_values;
// here am declairing the ExecuteReader to execute
SqlDataReade
dd_values =
cmd.ExecuteReader();
// here i am binding the dropdownlist with the
SqlDataReader
dd_name.DataSource = dd_values;
// here i am binding
the dropdownlist with the cloumn name of the table to show the
// name inside the dropdownlist
dd_name.DataValueField = "name";
dd_name.DataBind();
// after binding the dropdown list here i am closing and
disposing the SqlDataReader
dd_values.Dispose();
dd_values.Close();
}
}
Database
Script- create
a table in database named tb_register. Here I am giving you to complete
database script of the table tb_student_detail. See below:
/****** Object:
Table [dbo].[tb_student_detail]
Script Date: 04/10/2012 18:13:44 ******/
IF EXISTS (SELECT * FROM sys.objects WHERE object_id = OBJECT_ID(N'[dbo].[tb_student_detail]')
AND type in (N'U'))
DROP TABLE [dbo].[tb_student_detail]
GO
/****** Object:
Table [dbo].[tb_student_detail]
Script Date: 04/10/2012 18:13:44 ******/
SET ANSI_NULLS ON
GO
SET QUOTED_IDENTIFIER ON
GO
IF NOT EXISTS (SELECT * FROM sys.objects WHERE object_id = OBJECT_ID(N'[dbo].[tb_student_detail]')
AND type in (N'U'))
BEGIN
CREATE TABLE [dbo].[tb_student_detail](
[id] [bigint] IDENTITY(1,1) NOT NULL,
[name] [nvarchar](50) COLLATE SQL_Latin1_General_CP1_CI_AS NULL,
[science]
[nvarchar](50) COLLATE SQL_Latin1_General_CP1_CI_AS NULL,
[english]
[nvarchar](50) COLLATE SQL_Latin1_General_CP1_CI_AS NULL,
[math] [nvarchar](50) COLLATE SQL_Latin1_General_CP1_CI_AS NULL,
[biology]
[nvarchar](50) COLLATE SQL_Latin1_General_CP1_CI_AS NULL,
[botany] [nvarchar](50) COLLATE SQL_Latin1_General_CP1_CI_AS NULL,
CONSTRAINT [PK_tb_student_detail] PRIMARY KEY CLUSTERED
(
[id] ASC
)WITH (PAD_INDEX = OFF,
STATISTICS_NORECOMPUTE = OFF, IGNORE_DUP_KEY = OFF,
ALLOW_ROW_LOCKS =
ON,
ALLOW_PAGE_LOCKS = ON)
)
END
GO
SET IDENTITY_INSERT [dbo].[tb_student_detail]
ON
INSERT [dbo].[tb_student_detail] ([id], [name], [science], [english], [math], [biology], [botany]) VALUES (1, N'vikas', N'-45', N'20', N'-56', N'75', N'89')
INSERT [dbo].[tb_student_detail] ([id], [name], [science], [english], [math], [biology], [botany]) VALUES (2, N'ragubeer', N'-25', N'29', N'79', N'36', N'96')
INSERT [dbo].[tb_student_detail] ([id], [name], [science], [english], [math], [biology], [botany]) VALUES (3, N'akash', N'65', N'59', N'89', N'63', N'35')
INSERT [dbo].[tb_student_detail] ([id], [name], [science], [english], [math], [biology], [botany]) VALUES (4, N'vimal', N'-35', N'-59', N'23', N'46', N'87')
INSERT [dbo].[tb_student_detail] ([id], [name], [science], [english], [math], [biology], [botany]) VALUES (5, N'nisha', N'-65', N'99', N'93', N'56', N'21')
INSERT [dbo].[tb_student_detail] ([id], [name], [science], [english], [math], [biology], [botany]) VALUES (6, N'manav', N'52', N'39', N'63', N'21', N'38')
INSERT [dbo].[tb_student_detail] ([id], [name], [science], [english], [math], [biology], [botany]) VALUES (7, N'susheel', N'-96', N'-54', N'-63', N'29', N'36')
SET IDENTITY_INSERT [dbo].[tb_student_detail]
OFF
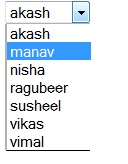
See output in this image:
Conclusion: In above code, I have been
explained that how we can bind
dropdownlist dynamically in asp.net. This code is very helpful for every .net
developer. Gud bye and take care developers.


