Introduction: Hello guys, in this article i will explain that how we can find nth highest salary of the employee using asp.net. This is very helpful artucle for the asp.net deveploer , to find the 1st,2nd, 3rHighest salary of the employee and so on for any company ,shop etc.
Implementation: Create a page named nth highest salary. Drag and drop a dropdownlist and Gridview from the toolbox. Below I am giving complete code for .aspx page and .aspx.cs page
Code for .aspx page:
<head runat="server">
<title>Nth Highesr salary of the employee</title>
</head>
<body>
<form id="form1" runat="server">
<div>
Select value <asp:DropDownList ID="dd_rank" runat="server" AutoPostBack="True"
onselectedindexchanged="dd_rank_SelectedIndexChanged">
</asp:DropDownList>
<br />
<br />
<br />
<asp:GridView ID="GridView1" runat="server" AutoGenerateColumns="False"
CellPadding="4" ForeColor="#333333" GridLines="None">
<RowStyle BackColor="#E3EAEB" />
<Columns>
<asp:TemplateField HeaderText="employee_name">
<ItemTemplate>
<asp:Label ID="Label1" runat="server" Text='<%# Eval("emp_name") %>'></asp:Label>
</ItemTemplate>
</asp:TemplateField>
<asp:TemplateField HeaderText="salary">
<ItemTemplate>
<asp:Label ID="Label2" runat="server" Text='<%# Eval("salary") %>'></asp:Label>
</ItemTemplate>
</asp:TemplateField>
</Columns>
<FooterStyle BackColor="#1C5E55" Font-Bold="True" ForeColor="White" />
<PagerStyle BackColor="#666666" ForeColor="White" HorizontalAlign="Center" />
<SelectedRowStyle BackColor="#C5BBAF" Font-Bold="True" ForeColor="#333333" />
<HeaderStyle BackColor="#1C5E55" Font-Bold="True" ForeColor="White" />
<EditRowStyle BackColor="#7C6F57" />
<AlternatingRowStyle BackColor="White" />
</asp:GridView>
<br />
<br />
</div>
</form>
Code for aspx.cs page:
using System;
using System.Configuration;
using System.Data;
using System.Linq;
using System.Web;
using System.Web.Security;
using System.Web.UI;
using System.Web.UI.HtmlControls;
using System.Web.UI.WebControls;
using System.Web.UI.WebControls.WebParts;
using System.Xml.Linq;
using System.Data.SqlClient;
public partial class _Default : System.Web.UI.Page
{
SqlConnection con = new SqlConnection();
SqlCommand cmd;
SqlDataAdapter adp;
DataTable dt;
protected void Page_Load(object sender, EventArgs e)
{
// here i am creating the connection with the database
con.ConnectionString = ConfigurationManager.ConnectionStrings["cn"].ConnectionString;
con.Open();
try
{
if(Page.IsPostBack == false)
{
// here i am calling the function that will bind the dropdownlist
bind_dd_rank();
}
}
catch
{
}
}
private void bind_dd_rank()
{
try
{
// here i am binding gridview with the column name rank
// in the below sql query am finding that how many type of salary. suppose there will be the salary of the 3 employee
// will 13000. it count it only 1 time. for eg:
//13000(1)
//13000(1)
//13000(1)
//13000(1)
//13000(1)
//12000(2)
//12000(2)
//12000(2)
//12000(2)
//10000(3)
//10000(3)
//10000(3)
//10000(3)
//10000(3)
// below quesry will give the output
// Salary rank
// 13000 1
// 12000 2
// 10000 3
// here m binding the dropdownlist with the rank so the dropdownlist
// show the value 1,2,3 and so on according to the values of the database
cmd = new SqlCommand(@"select salary, ROW_NUMBER () OVER (order by salary desc) as rank from
tb_emp_salary group by salary order by salary desc");
cmd.Connection = con;
SqlDataReader a;
// here i am using the ExecuteReader to bind the gridview
dd_rank.AppendDataBoundItems = true;
ListItem li = new ListItem();
li.Text = "Select";
li.Value = "Select";
dd_rank.Items.Add(li);
a = cmd.ExecuteReader();
dd_rank.DataSource = a;
// here m binding the dropdownlist with the rank field
dd_rank.DataValueField = "rank";
dd_rank.DataBind();
a.Close();
}
catch
{
}
}
// this function will use to bind the gridview
private void gdd_bind()
{
try
{
if (con.State == ConnectionState.Closed)
{
con.Open();
}
// here am using sql query to find nth salary of the employee
// SELECT TOP 1 salary
//FROM (
//SELECT DISTINCT TOP 6 salary
//FROM employee
//ORDER BY salary DESC) a
//ORDER BY salary
// in the above query you can find 6th highest salary of the employee
// there is a sub query inside the query that will find the top 6 salaries in desc order
// then from these top 6 we will find the top 1 order by desc order.
// below i am using this query but inplace of 6 i am passing value from the dropdownlist
// so you can find nth salary of the employee..
// for eg: 1st,2nd,3rd,4th,5th and so on according to the database
adp = new SqlDataAdapter(@"SELECT * FROM tb_emp_salary where salary =(SELECT TOP 1 salary FROM (SELECT DISTINCT TOP " + dd_rank.SelectedItem.Text + " salary FROM tb_emp_salary ORDER BY salary DESC) a ORDER BY salary)", con);
dt = new DataTable();
adp.Fill(dt);
adp.Dispose();
GridView1.DataSource = dt;
GridView1.DataBind();
}
catch
{
}
}
protected void dd_rank_SelectedIndexChanged(object sender, EventArgs e)
{
// here i am calling function for binding the gridview
// when user will select any value from the dropdownlist
// then this function performs and bind the gridview with the nth highest salary
//
gdd_bind();
}
}
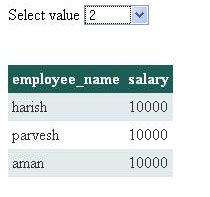
See output in this image:
Sql Script for database:
/****** Object: Table [dbo].[tb_emp_salary] Script Date: 07/26/2011 16:12:22 ******/
IF EXISTS (SELECT * FROM sys.objects WHERE object_id = OBJECT_ID(N'[dbo].[tb_emp_salary]') AND type in (N'U'))
DROP TABLE [dbo].[tb_emp_salary]
GO
/****** Object: Table [dbo].[tb_emp_salary] Script Date: 07/26/2011 16:12:22 ******/
SET ANSI_NULLS ON
GO
SET QUOTED_IDENTIFIER ON
GO
IF NOT EXISTS (SELECT * FROM sys.objects WHERE object_id = OBJECT_ID(N'[dbo].[tb_emp_salary]') AND type in (N'U'))
BEGIN
CREATE TABLE [dbo].[tb_emp_salary](
[id] [bigint] IDENTITY(1,1) NOT NULL,
[emp_name] [varchar](50) COLLATE SQL_Latin1_General_CP1_CI_AS NULL,
[salary] [int] NULL,
CONSTRAINT [PK_tb_emp_salary] PRIMARY KEY CLUSTERED
(
[id] ASC
)WITH (PAD_INDEX = OFF, STATISTICS_NORECOMPUTE = OFF, IGNORE_DUP_KEY = OFF, ALLOW_ROW_LOCKS = ON, ALLOW_PAGE_LOCKS = ON)
)
END
GO
SET IDENTITY_INSERT [dbo].[tb_emp_salary] ON
INSERT [dbo].[tb_emp_salary] ([id], [emp_name], [salary]) VALUES (1, N'vimal', 12000)
INSERT [dbo].[tb_emp_salary] ([id], [emp_name], [salary]) VALUES (2, N'harish', 10000)
INSERT [dbo].[tb_emp_salary] ([id], [emp_name], [salary]) VALUES (3, N'parvesh', 10000)
INSERT [dbo].[tb_emp_salary] ([id], [emp_name], [salary]) VALUES (4, N'aman', 10000)
INSERT [dbo].[tb_emp_salary] ([id], [emp_name], [salary]) VALUES (5, N'deepak', 9000)
INSERT [dbo].[tb_emp_salary] ([id], [emp_name], [salary]) VALUES (6, N'anver', 9000)
INSERT [dbo].[tb_emp_salary] ([id], [emp_name], [salary]) VALUES (7, N'ranbeer', 8000)
INSERT [dbo].[tb_emp_salary] ([id], [emp_name], [salary]) VALUES (8, N'neetu', 8000)
INSERT [dbo].[tb_emp_salary] ([id], [emp_name], [salary]) VALUES (9, N'renu', 7000)
SET IDENTITY_INSERT [dbo].[tb_emp_salary] OFF
Conclusion
Through this article, you have learned how to find nth highest salary of the employee in asp.net .
Okas guys, enjoy this code..
Thanx
