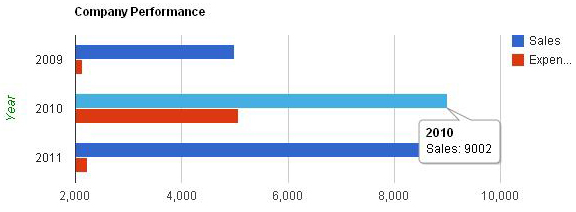
Introduction: Hello dears, in this article i will explain that how we can create Visualization: Bar Chart using asp.net. This is very helpful artucle for the asp.net deveploer to creating a mast graph in asp.net. This type of chart you can create to showing purchase and sale or sale and expences or yes or no etc in different years.
Implementation: Here i am taking the reference from the below link . http://code.google.com/apis/chart/interactive/docs/gallery/barchart.html
Google use javascript code for the implementation of this graph. I am using same javascript code but am giving also my asp.net experience with this code. And create the same graph in Asp.Net.
Code for .aspx page:
<head id="Head1" runat="server">
<title>Bar Graph using Google Visualization</title>
<%--the below two javascripts are needed to run this program you can
also download this script from the below link --%>
<script type="text/javascript" src="https://www.google.com/jsapi"></script>
</head>
<body>
<form id="form1" runat="server">
<div>
<asp:Literal ID="lt" runat="server"></asp:Literal>
</div>
<div id="chart_div"></div>
</form>
</body>
Code for aspx.cs page:
using System;
using System.Collections;
using System.Configuration;
using System.Data;
using System.Linq;
using System.Web;
using System.Web.Security;
using System.Web.UI;
using System.Web.UI.HtmlControls;
using System.Web.UI.WebControls;
using System.Web.UI.WebControls.WebParts;
using System.Xml.Linq;
using System.Data.SqlClient;
using System.Text;
public partial class chart_sale_purchage : System.Web.UI.Page
{
// complete code of Visualization: Combo Chart
SqlConnection con = new SqlConnection();
// here am declairing the stringbuilder class
StringBuilder str = new StringBuilder();
protected void Page_Load(object sender, EventArgs e)
{
// here i am declare connection
con.ConnectionString = ConfigurationManager.ConnectionStrings["cn"].ConnectionString;
con.Open();
if (Page.IsPostBack == false)
{
// here i am calling function chart_bind(); in the page load event of the page
chart_bind();
}
}
private void chart_bind()
{
// here i am using SqlDataAdapter for the sql server select query
SqlDataAdapter adp = new SqlDataAdapter("select top(7)* from tb_exp", con);
// here am taking datatable
DataTable dt = new DataTable();
try
{
// here datatale dt is fill wit the adp
adp.Fill(dt);
// this string m catching in the stringbuilder class
// in the str m writing same javascript code that is given by the google.
// but m changing only below line
//data.addColumn('string'(datatype), 'Year'(columnname according to the sql table));
//data.addColumn('number'(datatype), 'Sales'(columnname according to the sql table));
//data.addColumn('number'(datatype), 'Expenses'(columnname according to the sql table));
// my data that will come from the sql server
// in the below line i need " in place of *
// stringbuilder can't return us " so at the last line i am
// replacing * with the " using Replace('*', '"'); function
// and other code is same like the google code
str.Append(@"<script type=text/javascript> google.load( *visualization*, *1*, {packages:[*corechart*]});
google.setOnLoadCallback(drawChart);
function drawChart() {
var data = new google.visualization.DataTable();
data.addColumn('string', 'Year');
data.addColumn('number', 'Sales');
data.addColumn('number', 'Expenses');
data.addRows(" + dt.Rows.Count + ");");
Int32 i;
//here i am using for loop to fetch multiple recorod from the database
for (i = 0; i <= dt.Rows.Count - 1; i++)
{
// i need this type of output " data.setValue(0, 0, '2004');",(1, 0, '2005');" * so on in the first line so for this
//m using i for the 1& 2 and so on . and after this i am writting zero and after this year using datatable
str.Append("data.setValue( " + i + "," + 0 + "," + "'" + dt.Rows[i]["year"].ToString() + "');");
// i need this type of output " data.setValue(0, 1, 'sales');",(1, 1, 'sales');" * so on in the first line so for this
//m using i for the 1& 2 and so on . and after this i am writting 1 and after this sales using datatable
str.Append("data.setValue(" + i + "," + 1 + "," + dt.Rows[i]["sales"].ToString() + ") ;");
// i need this type of output " data.setValue(0,2, 'expences');",(1, 2, 'sales');" * so on in the first line so for this
//m using i for the 1& 2 and so on . and after this i am writting 2 and after this expences using datatable
str.Append(" data.setValue(" + i + "," + 2 + "," + dt.Rows[i]["expences"].ToString() + ");");
}
// the other code same like as google's javascript code
str.Append(" var chart = new google.visualization.BarChart(document.getElementById('chart_div'));");
// in the below line you can set width height of the chart according to your need
str.Append(" chart.draw(data, {width: 600, height: 240, title: 'Company Performance',");
// str.Append(" var chart = new google.visualization.BarChart(document.getElementById('chart_div'));");
str.Append("vAxis: {title: 'Year', titleTextStyle: {color: 'green'}}");
str.Append("}); }");
str.Append("</script>");
lt.Text = str.ToString().TrimEnd(',').Replace('*', '"');
con.Close();
}
catch
{
}
finally
{
con.Close();
}
}
}
See output in this image:
Sql Script for database:
/****** Object: Table [dbo].[tb_exp] Script Date: 07/07/2011 16:40:07 ******/
IF EXISTS (SELECT * FROM sys.objects WHERE object_id = OBJECT_ID(N'[dbo].[tb_exp]') AND type in (N'U'))
DROP TABLE [dbo].[tb_exp]
GO
/****** Object: Table [dbo].[tb_exp] Script Date: 07/07/2011 16:40:07 ******/
SET ANSI_NULLS ON
GO
SET QUOTED_IDENTIFIER ON
GO
IF NOT EXISTS (SELECT * FROM sys.objects WHERE object_id = OBJECT_ID(N'[dbo].[tb_exp]') AND type in (N'U'))
BEGIN
CREATE TABLE [dbo].[tb_exp](
[id] [bigint] IDENTITY(1,1) NOT NULL,
[year] [varchar](50) COLLATE SQL_Latin1_General_CP1_CI_AS NULL,
[sales] [varchar](50) COLLATE SQL_Latin1_General_CP1_CI_AS NULL,
[expences] [varchar](50) COLLATE SQL_Latin1_General_CP1_CI_AS NULL,
CONSTRAINT [PK_tb_exp] PRIMARY KEY CLUSTERED
(
[id] ASC
)WITH (PAD_INDEX = OFF, STATISTICS_NORECOMPUTE = OFF, IGNORE_DUP_KEY = OFF, ALLOW_ROW_LOCKS = ON, ALLOW_PAGE_LOCKS = ON)
)
END
GO
SET IDENTITY_INSERT [dbo].[tb_exp] ON
INSERT [dbo].[tb_exp] ([id], [year], [sales], [expences]) VALUES (1, N'2009', N'5000', N'2136')
INSERT [dbo].[tb_exp] ([id], [year], [sales], [expences]) VALUES (2, N'2010', N'9002', N'5063')
INSERT [dbo].[tb_exp] ([id], [year], [sales], [expences]) VALUES (3, N'2011', N'8800', N'2225')
SET IDENTITY_INSERT [dbo].[tb_exp] OFF
Conclusion
Through this article, you have learned how to create Visualization: bar Chart using the google’s javascript code as well as asp.net code.
Okas guys, enjoy the code. Meet in next article again.
Thanx.
thanks alot
ReplyDeleteHi!!! Falah Masry, Its mine pleasure dear.. If you have any suggestion to improve my next comng articles then you can send me your expensive suggestions. Please feel free to get in touch with my blog.
DeleteThanks
Hi I have tried this. But the chart is not showing. Do I need to reference any assembly.Everything from database also has been populated but the chart is not showing finally
ReplyDeleteHi!! jeya.. There is no need for any type of assembly for this chart. On the my end this is working fine. have u find any type of error. And Which browser u r using right now to execute this chart? use mozilla or crome. i think you have IE browser lowest version.
Deletethe issue If I try to have columns as datetime and number the chart is not showing.Is there any specific way for using datetime column in charts ? Could you please help me out in this
ReplyDeleteI found the problem as I created column as datetime.I created it as string
ReplyDeleteok!! Great Jeya.. If you have any suggestion to improve my next comng articles then you can send me your expensive suggestions. Please feel free to get in touch with my blog.
DeleteThanks
Regards
Using asp.net
just one sugession if you can share the project as zip download
ReplyDeleteHi!! neeraj There is no need for the zip file for this. Here i am writting the complete code for .aspx page as well as .aspx.cs page and also giving the sql script. Just copy the complete code and paste it into your file and enjoy the complete code.
DeleteThanks
Bharat Bhushan
This comment has been removed by the author.
ReplyDeleteHi,
ReplyDeleteWe are looking for good quality line chart. We have gone through your trial line chart. But we need example chart for satisfied all requirement below features. Looking forward for your response at earliest.
Note: We are using Asp.net 4.0 and we are data binding from database into line chart.
Features expected in the chart :
1. Should have all common graph types like line, bar, column, Pie. And good to have graph types like Area, Circular, Distribution, Financial, Funnel, Range etc.,
2. Combination of charts should be possible
3. Animations like call outs should be available (It will be helpful if tabular format can be displayed in chart or callout)
4. Multiple Y axis should be possible
5. No of points on y axis should be in our control
6. We should be allowed to set interval on Y axis
7. Minimum and maximum values should be allowed to set by us
8. Data should be coming from database
9. Labels for each data point should be possible
10. Tool tip should be available
11. Data Points should be clickable and navigation to another graph or another page should be possible.
12. Drill down of graphs should be possible
13. Smart labels should be available
14. Markers should be available.
Regards,
Silambarasan .B
me also looking for same features if it is possible in Google Chart API i do the same in MSChart
DeleteCan we change the CSS of bars???
ReplyDeleteHi!!ainy mughal.
DeleteYes you can change the css or bars. For this you need to read the complete article on the developer.google.com . See this link
https://developers.google.com/chart/interactive/docs/gallery/linechart
Thanks
Using Asp.Net
Great Example Thank you very much. Do you have another example where you are applying the gauge chart and pie charts
ReplyDeleteHi!! ASP.NET. If you have any suggestion to improve our next comng articles then you can send us your great ideas. Please feel free to get in touch with our blog.
DeleteThanks
Regards
Using asp.net
Graph not showing i m newbie on Google Chart
ReplyDelete